How Rittman Analytics Does Web Analytics and Marketing Attribution, using Google BigQuery, Looker, dbt and Segment
As a boutique data analytics consultancy that gets most of its new clients through enquiries from our website, its obviously fairly critical to our growth that potential new clients find and discover our site easily and once they do, stick around and (hopefully, why don’t you try it out…) book a discovery call with us to find-out how we can make their analytics vision a reality.
Looking at this in the form of a classic marketing funnel you can divide those marketing activities and the spend they incur into three broad categories:
“Top of Funnel” activities and touchpoints that attract traffic to our site that will find our content relevant and engaging
“Middle of Funnel” website pages and marketing touchpoints that help visitors with an interest in our services find the information they need
“Bottom of Funnel” site pages and third-party services that aim to turn that interest into a booked-meeting to find-out how we can help

We therefore wanted to create a web performance dashboard that brought together all of our key web performance metrics in one place, organized by marketing funnel layer and adding enough context in order for those metrics to become actionable.
As we did before with our business KPIs dashboard, the first step was to sit down with stakeholders and come-up with a set of problems to be solved and a process by which solve those problems, expressed in the form of a wireframe dashboard design shown in the diagram below.

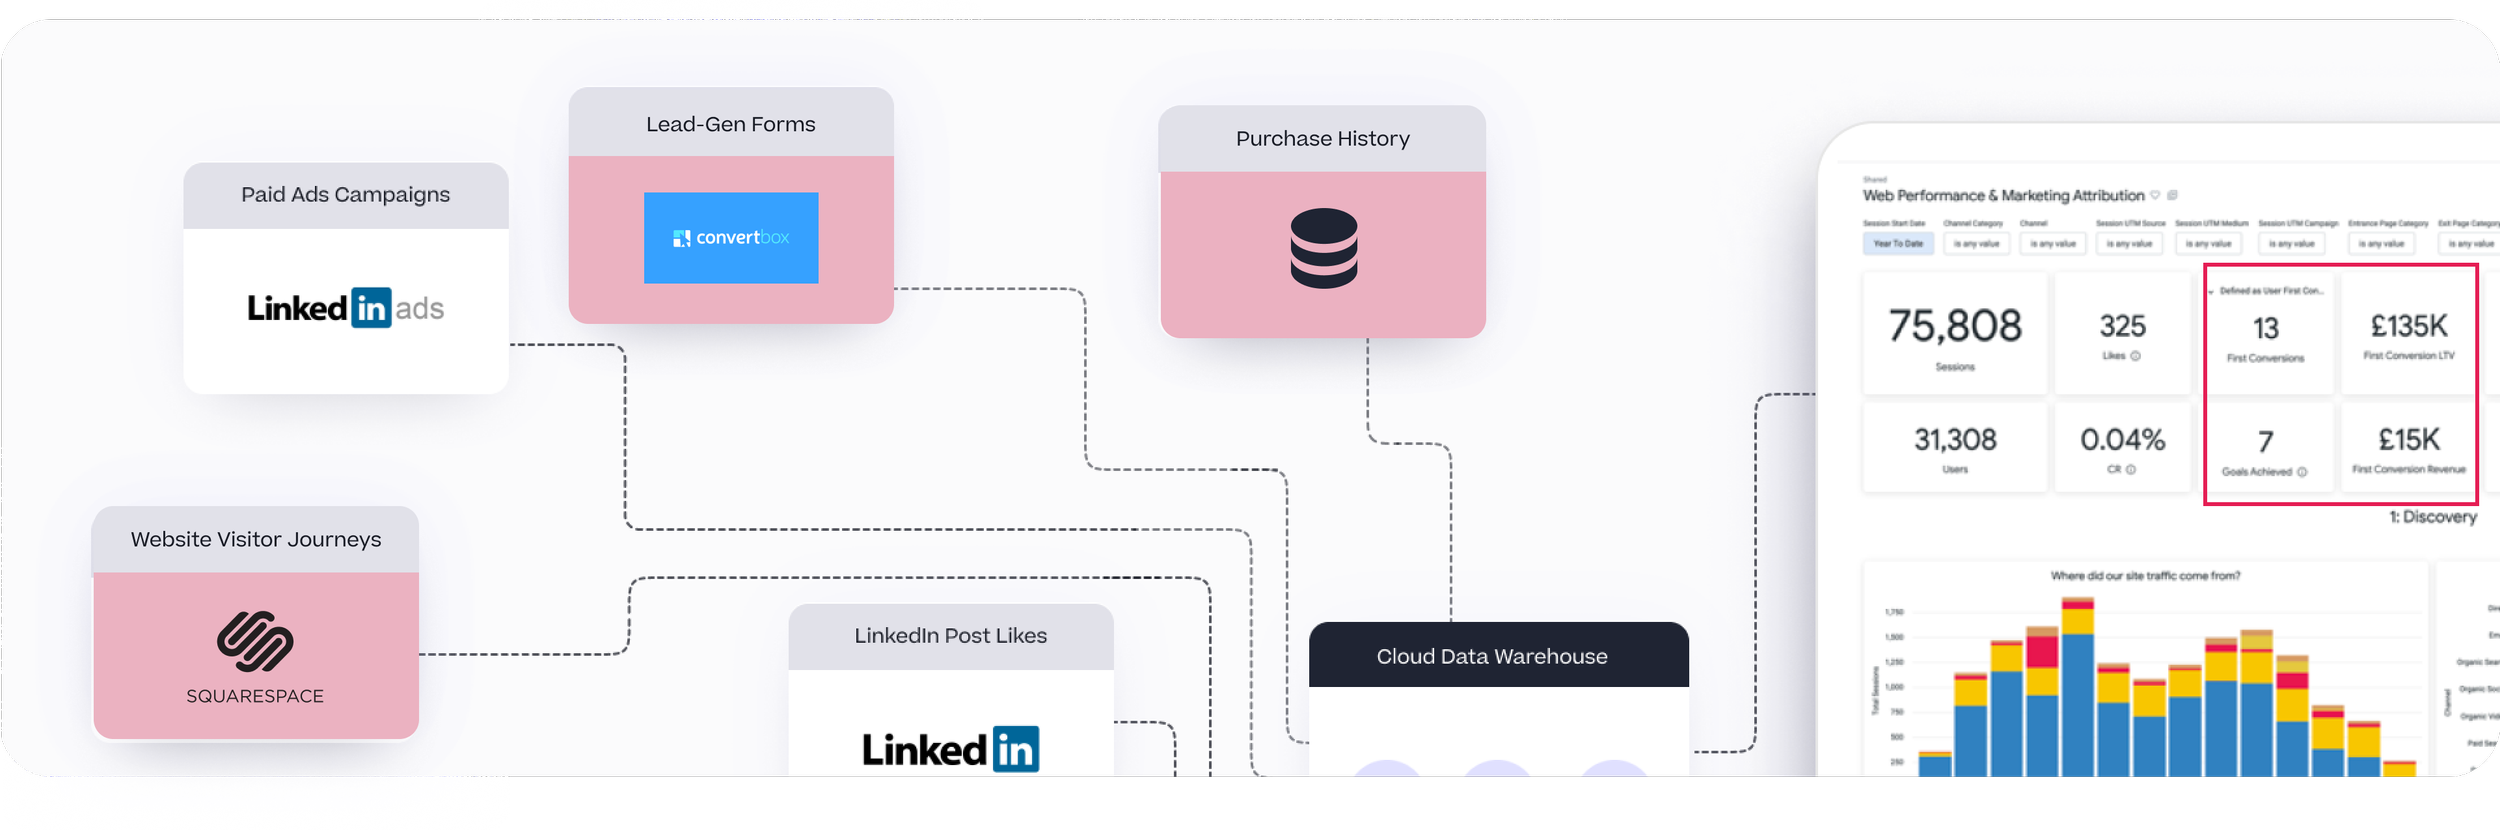
Creating such as dashboard that spanned all of our marketing activities, visitor digital touchpoints and data on their transaction history required us to bring data in from a number of different data sources including website clickstream data, lead collection and meeting booking data from third-party services such as ConvertBox and Calendly, ad network and social media data as well as operational stored in our centralised data warehouse, Google BigQuery.
To do this we first landed all of our marketing and customer data sources in Google BigQuery, our cloud data warehouse and then used the open-source dbt Core toolkit to format, join and then combine all of this data into a single dataset and “version of the truth” ready for building our dashboard in Looker.

(We could, theoretically at least, have use Looker Studio (or even regular Looker) to somewhat shortcut this process to instead create a “single pane of glass” integrated dashboard view of these data sources, but this would quickly become unwieldy as the number of data sources increased and would still would leave us with silos of reporting data that could only be analyzed in isolation, not connected to each other)
The Web Performance and Marketing Attribution dashboard is shown in the screenshot below, where we’ve taken the wireframe design and used it as the design template for a Looker dashboard.

The dashboard is organized into four sections, one for headline metrics and three others that correspond to (groups of) layers in our marketing funnel.
Headline Metrics & KPIs : key metrics and indicators that, at-a-glance, give us the state of our marketing activities over the past 30 days
Top-of-Funnel Metrics & KPIs : metrics and data visualizations that tell us how we’ve performed at bringing-in high-quality traffic to our site
Middle-of-Funnel Metrics & KPIs : metrics and KPIs that measure how effective we’ve been at directing and helping that traffic discover relevant content about the services we offer
Bottom-of-Funnel Metrics & KPIs : metrics and visualizations that show how each of our marketing channels have contributed to conversions (booked meetings) and goals achieved (contact buttons pressed)
Headline Conversion Metrics and Identity Stitching
For our headline metrics and alongside obvious ones to include such as Sessions, Users, Paid Ad Spend and Cost-per-Click (CPC), we also wanted to highlight performance in bringing-in first meetings with potential new clients as those are the biggest driver of new incremental revenue for our business.

To emphasise the value of these first meetings we identity-stitched the anonymous and identified website interactions for each of our converting users, making sure that at all times when we hand-off a user to a third-party service such as Calendly or ConvertBox we always include the device-based anonymousId that Segment assigns to each site visitor.

Doing so ensures that when we send Segment track and identify events from those services back to Segment to record a conversion, we can then connect those events back to the journey that user took anonymously that eventually led to that conversion.
Because we identify our site users using their email address, we can also then connect those users to data from HubSpot, our sales and CRM system that feeds into our operational data warehouse, allowing us to assign first conversion and lifetime value revenue numbers to those converting users albeit with several weeks or months lag between conversion and deal closure.
Measuring Middle-of-Funnel Performance for acquisition channels and marketing pages
For each of the marketing channels that bring visitors to our website along with blog articles and the marketing, services and case-study pages on our site, our measurement of performance is how effective each were in moving those visitors down through our marketing funnel.

Data visualisations such as these that connect-together activity at one stage in the marketing funnel — interacting with a post we published on LinkedIn, liking an X tweet or clicking on a paid social promotion, for example — with subsequent session page view data from the website sessions resulting from those interactions — are easy to set-up in Looker using the Merge Query feature, as you can see from the example below.

Attributing Conversions to our Top-, Middle- and Bottom-of-Funnel Marketing Channels
For the final, bottom-of-funnel channel layer of our Web Performance dashboard, reporting on conversions in a meaningful way is surprisingly hard:
Do we report the total number of conversions (meeting bookings) over a given time period and compare that to the total number of user sessions? Or does session conversion rate (total sessions containing at least one conversion divided by total sessions) or even user conversion rate (number of converting users compared to total users)?
Are we interested in all conversions by a user, or do we wish to report separately on first conversions (far more important, revenue-wise) and then roll-up any second, third, fourth conversions into a single repeat conversions metric?
Most importantly though in determining the value each channel delivers for our business, how do we meaningfully attribute that value when last-click attribution (assigning the conversion to the channel the conversion event occurred in) assigns that conversion in most cases to direct.
For users that go on to book meetings its more typical that they arrive by finding us in a Google Search, take a look around and then return a few days later to book a meeting to find out more about our services.
That same user might not be in a position to move ahead right then with their project but returns a week later after being reminded of us through a paid social post on LinkedIn, gets distracted and then finally types our website address into their browser, clicks on the button to book a meeting and converts for a second time.
What we therefore need is a method of attributing conversions to marketing channels that enables us to thereby understand:
which marketing channels are most effective in bringing-in users that eventually go-on to convert (first non-direct click attribution)
which marketing channels are most effective in closing that interest and turning it into a conversion (last non-direct click attribution)
what are the mix of marketing channels that typically feature in a converting visitor journey (even-click or linear attribution)
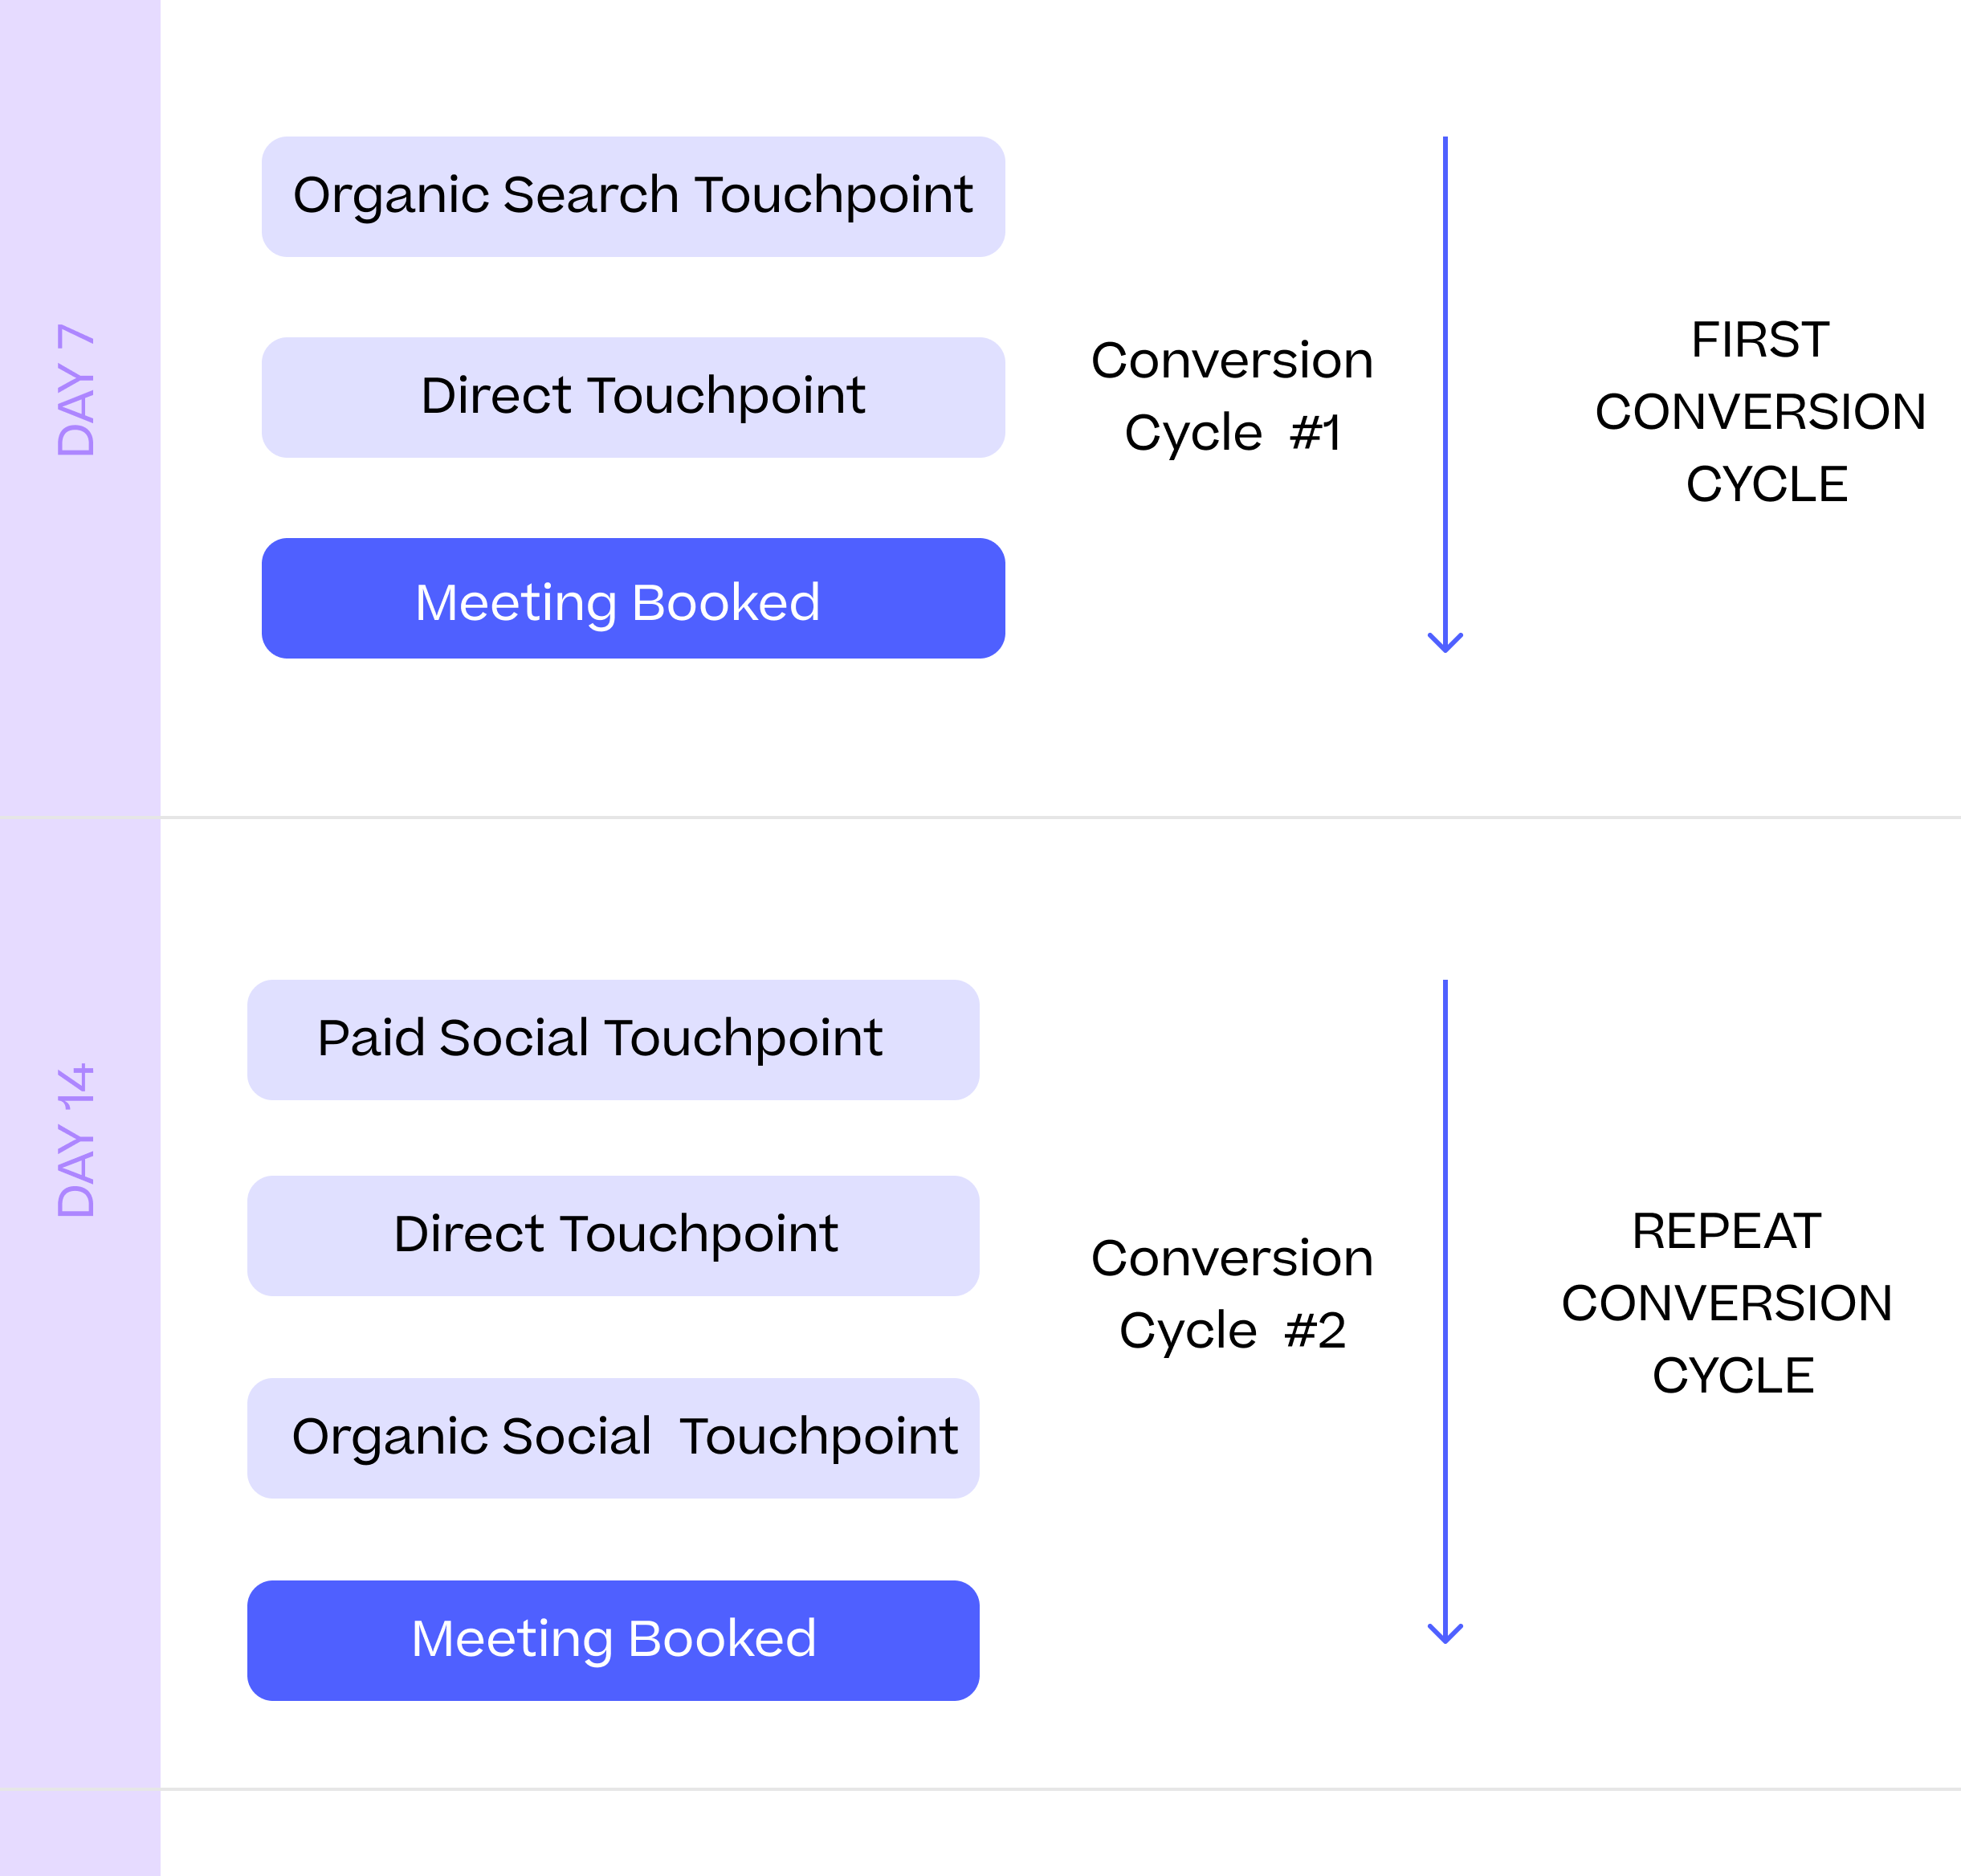
We do this by leveraging the multi-touch, multi-cycle marketing attribution dbt package we’ve made available on our public Github account (along with a Looker block version optimized for Google Analytics 4) and used it, together with the identity-stitching logic outlined earlier in this blog to attribute the value of each users’ conversion across each separate conversion cycle, as you can see in the recent example shown below.

We then use the first non-direct click, last non-direct click and even (linear)-click attribution model data to provide visualizations for the final marketing funnel layer of our dashboard,

Interested? Find Out More!
Rittman Analytics is a boutique data analytics consultancy that works with growth-stage, mid-market and enterprise businesses in the UK, EU and North America to help level-up their marketing analytics capabilities and build world-class web performance and marketing attribution models - just like the one we’ve built for ourselves and described in this blog post.

We’re authorised delivery partners for Google Cloud (for Looker and Looker Studio), Snowflake, Oracle, Segment and Rudderstack along with Cube, Dagster, Preset, dbt Labs, Fivetran and Lightdash — we love them all and are experts at helping you choose the right ones for your organisation’s needs, use-cases and budget and working with you and your data team to make them all a success.
If you’re looking for some help and assistance with your marketing analytics or would just like to talk shop and share ideas and thoughts on what’s going on in your organisation and the wider data analytics world, contact us now to organise a 100%-free, no-obligation call — we’d love to hear from you!