Benchmarking your Financial Performance using Looker and Google BigQuery
Benchmarking is the process of measuring the performance of a company’s products, services, or processes against those of another business considered to be the best in the industry. Not just about gathering this competitor data, it’s about understanding where a company stands in comparison to its peers and identifying areas of improvement to improve your competitive advantage.
The value in benchmarking lies in its ability to provide actionable insights. By understanding the performance metrics of your competitors you can set realistic goals, foster innovation, and implement strategies that drive growth. It’s a tool for continuous improvement, enabling businesses to stay relevant, competitive and aware of what they need to do in order to beat their competition.
SaaS providers are in a unique position to offer benchmarking analysis as they uniquely, at least compared to indivual companies, have access to a wealth of data from a diverse customer base. This data, when anonymised and aggregated, can provide valuable insights into industry trends, performance standards, and best practices.
As a boutique analytics consultancy Rittman Analytics uses Google BigQuery and Looker to store and report-on our financial data, extracted every hour from Xero, our accounting SaaS application, using Fivetran.

At a basic level this warehoused financial data enables us to create reports such as the one below showing our (obfuscated for demo purposes) sales revenue, cost of delivery and other financial metrics.
As well as presenting the actual numbers for sales, admin costs and other measures we also use Looker to calculate the change year-on-year for each of these measures along with the percentage of sales revenue taken-up by delivery and admin costs each year.
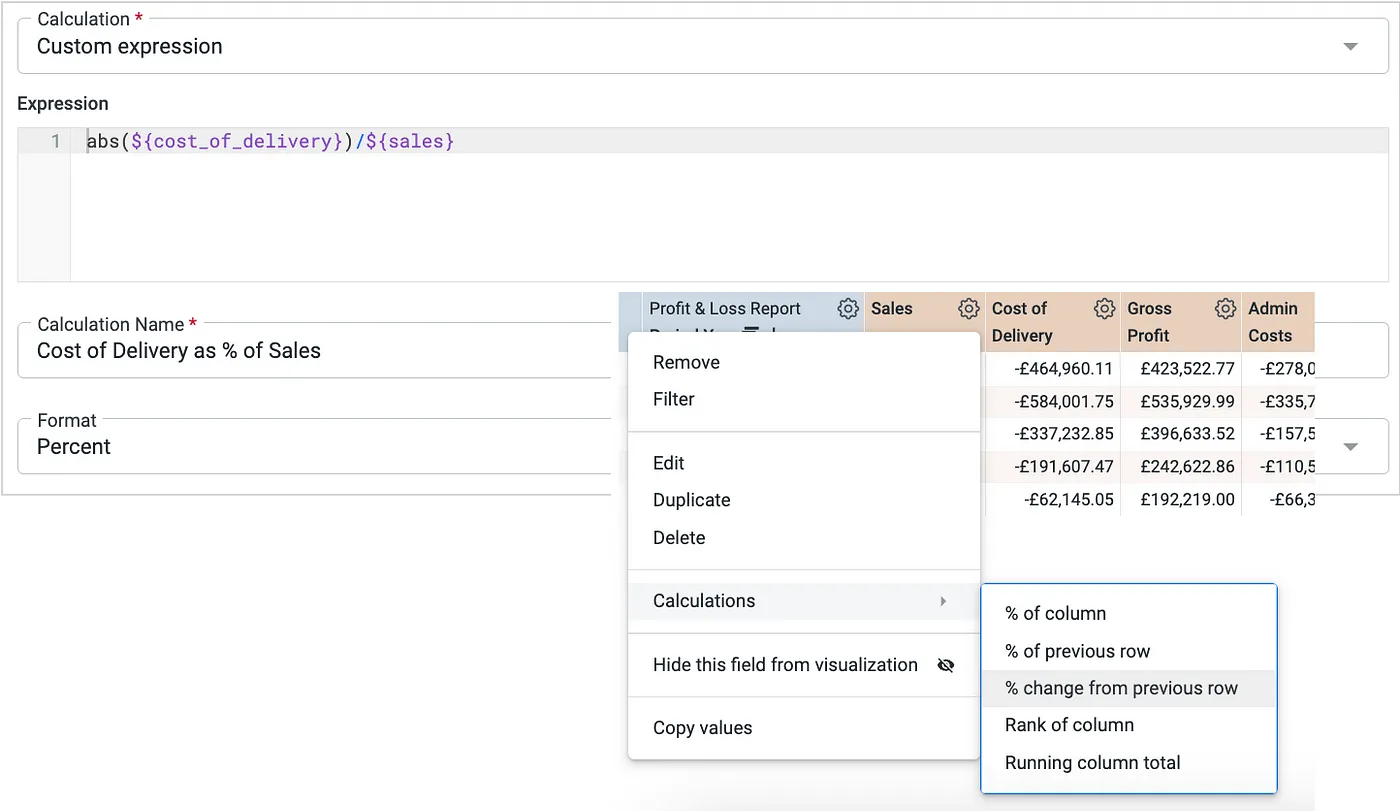
We can then take those measures and calculated measures and display them as dashboard tiles, for example, to show us how much of our revenue is taken-up by direct cost of delivery.
But does 52% of project revenue taken-up by the cost of delivering that project represent good performance or is it something we should be concerned about?

Whilst there are rules-of-thumb for cost ratios that you could compare your company’s performance against, what we really want to understand is how our cost ratios compare to our competitors — is our cost structure better or worse than the competition and what does “good’ look like for analytics consultancies of our size and stage in development?
One effective way to conduct benchmarking analysis, particularly for financial data, is by leveraging services like Pomanda. Pomanda offers a blend of publicly available data from sources like Companies House and proprietary models that estimate financial metrics based on industry sector and other factors.
We start by researching and understanding who are the relevant competitors in our market, coming-up with a list of around ten company names that we typically come-up against in competitive bids.
We then use Pomanda to export, for each competitor, the basic financial data each company publishes in their abbreviated accounts at Companies House along with Pomanda’s enrichment of that data using modeled financial metrics. Pomanda’s algorithms estimate various financial indicators that are not publicly disclosed, giving us metrics to match our internal cost of delivery, cost of administration and other ones
This enriched dataset is then loaded into Google BigQuery with further enrichments and calculated columns to index each year’s company numbers with the years since incorporation
create table analytics_seed.company_benchmarking_data
  as
  select
    company_name,
    year,
    row_number() over (partition by company_name, measure order by year) as years_operating,
    min(year) over (partition by company_name order by year) as year_founded,
    count(distinct year) over (partition by company_name, measure) as total_years_operating,
    measure,
    value
  from
    `ra-development.analytics_seed.pomanda_upload`
At this point we then perform an initial analysis of the benchmarking dataset, starting by charting the annual revenue for each company over a particular year (company names obfuscated in my examples)

Something that’s immediately obvious when looking at this chart is that it would make sense to group these competitors into segments for boutique, medium and large-size companies, so that when comparing cost ratios for example we compare against companies at a similar stage in development at that particular point in-time
With the enriched dataset, we then use Looker and Google BigQuery to perform detailed benchmarking analysis, identifying trends, comparing performance metrics and uncover actionable insights.
For example, if we index each year’s financial data from the first year’s set of accounts available and merge two Looker queries together, the first just returning our sales number for the years we’ve been operating and then merging that with a separate query that returns average sales for all companies in our segment except ourselves.

We can see how our sales numbers compare to the average for our market segment for each of the years since we founded the company.; the reason that the segment size varies from year to year is that a company’s turnover might make them a boutique segment company one year but as they grow, next year could move them into the medium-size segment.

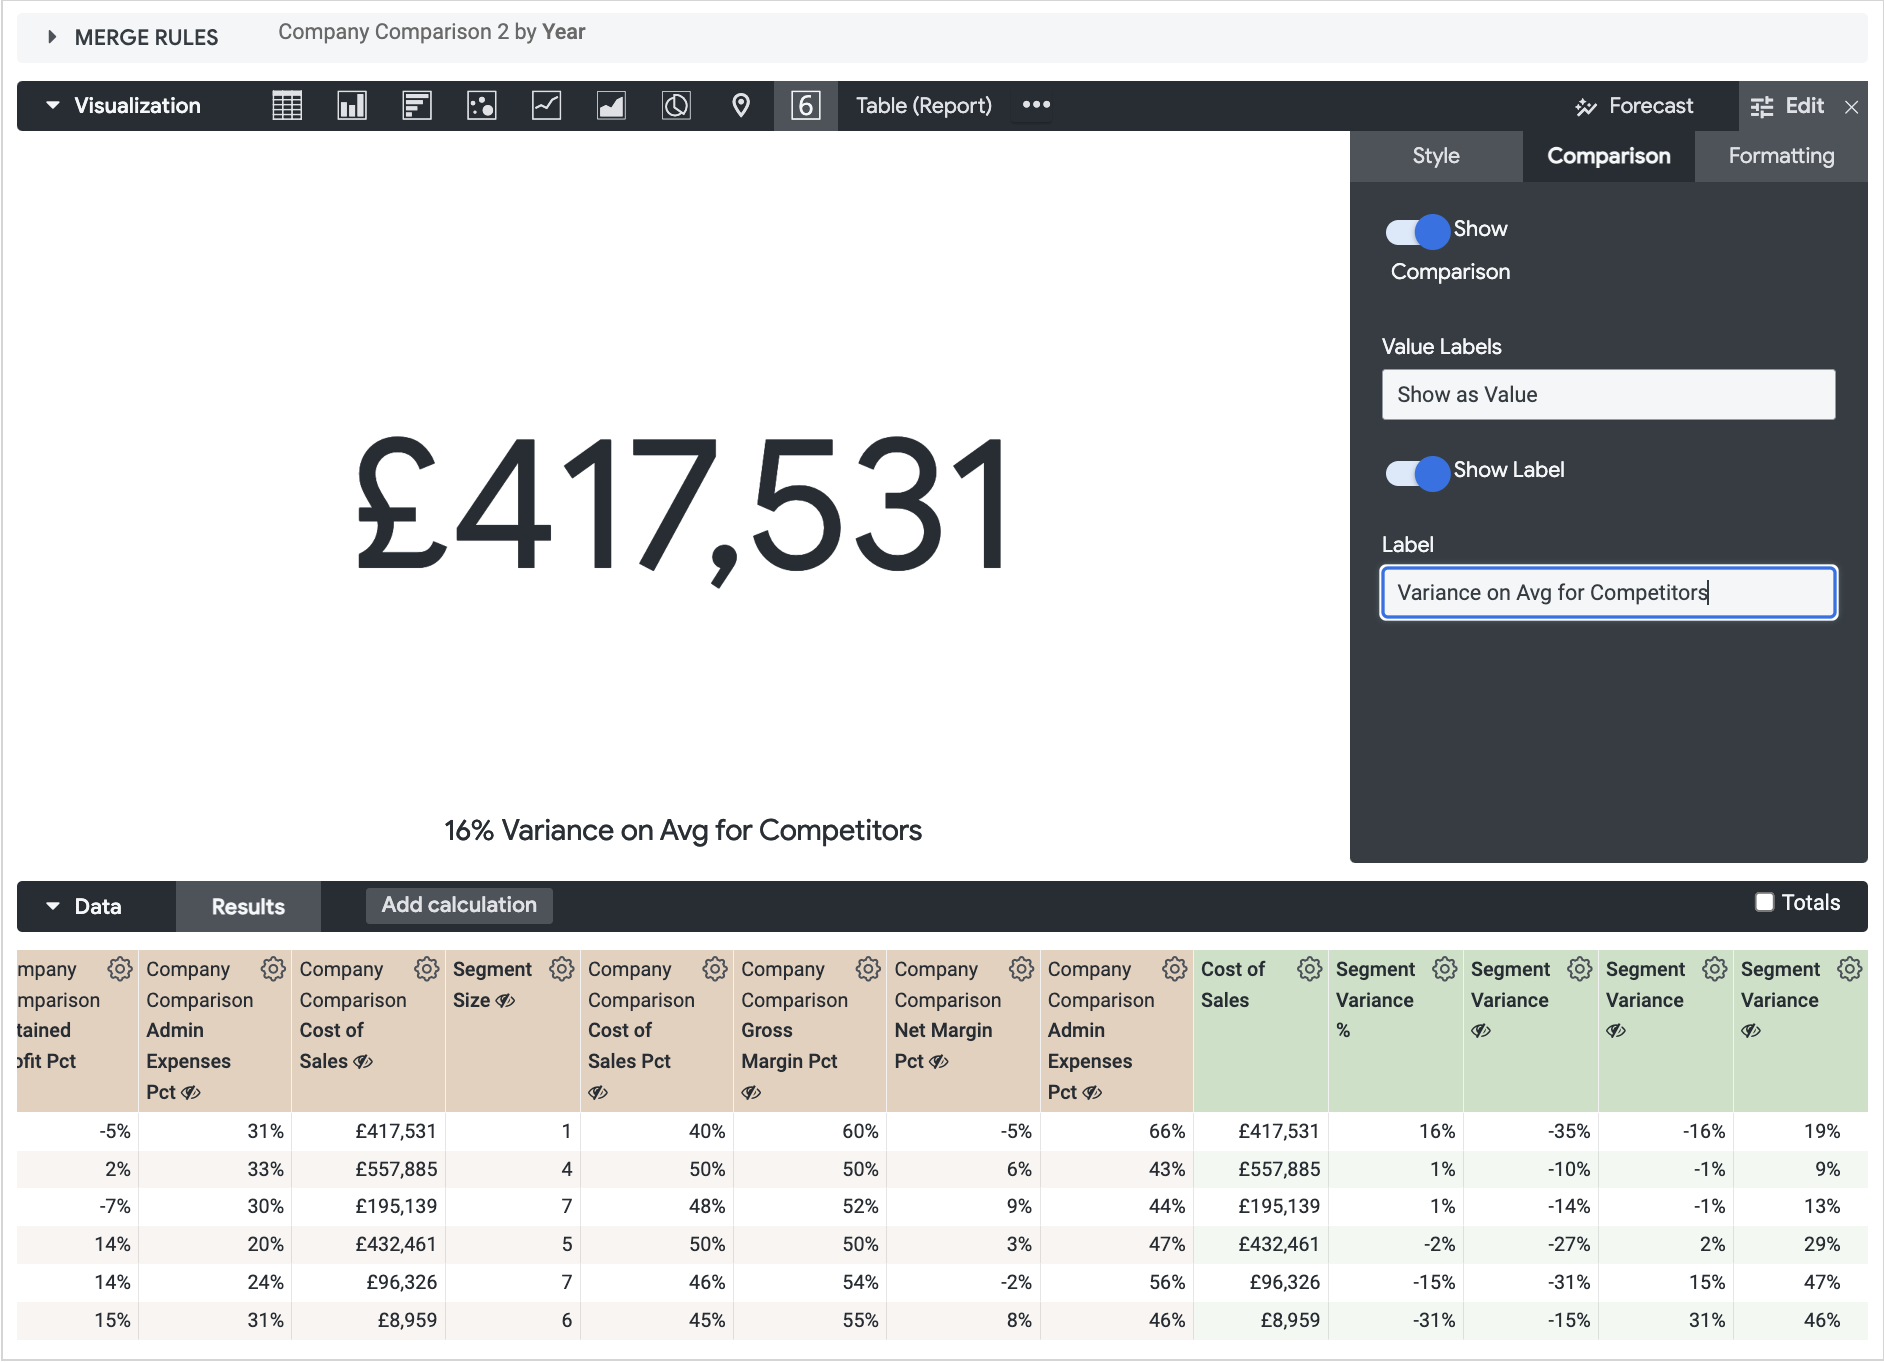
The most valuable benchmarking analysis we now have access to though is comparing our cost ratios, which we can do by merging our own cost of sales as % of sales revenue, cost of adminstration as % of sales along with net and gross margin % with the average for our competitors, in our segment, each year.

Comparing our ratios against the average for our segment each year shows us whether our cost structure has been competitive or not over time; looking at the results below (using obfuscated numbers) we’d need to look carefully at our cost of delivery this coming year in order to remain competitive.

We could then use these variance against the average for our segment in tile-style visualization like this one, where we display a cost metric but then compare against our competition rather than previous period, for example.
For anyone who thinks that consultancies charge too much for a project or as a consultant’s hourly rate, looking at the first five years trading for the average of all consultancies you can see that the average gross margin, net margin and retained profit margin (after all expenses including tax) all get worse the longer the company has been trading.

And finally, if you chart those same margins and split by company size segment you can see that it’s boutique and large consultancies that are the most profitable - retained earnings are the best way of comparing real net profit as boutique consultancies often pay founders in dividends which aren’t counted when calculating (taxable) net profit but need to be considered when you want to know the true profitability of the business.
Interested? Find Out More!
Rittman Analytics is a boutique data analytics consultancy that helps ambitious, digital-native businesses scale-up their approach to data, analytics and AI.
We’re authorised delivery partners for Google Cloud along with Oracle, Segment, Cube, Dagster, Preset, dbt Labs and Fivetran and are experts at helping you build financial analytics and scalable, cloud-hosted data stacks that are designed for your organisation’s needs, use-cases and budget.
If you’re looking for some help and assistance with your benchmarking initiative or would just like to talk shop and share ideas and thoughts on what’s going on in your organisation and the wider data analytics world, contact us now to organise a 100%-free, no-obligation call — we’d love to hear from you!